Showing every subjectChange subjects

0625/04/SP/23 · question 4 of 5 in this topic

Question 1

1(a)3 marks

Fig. 1.1 shows the speed-time graph for a vehicle accelerating from rest.

Calculate the acceleration of the vehicle at time t = 30 s.
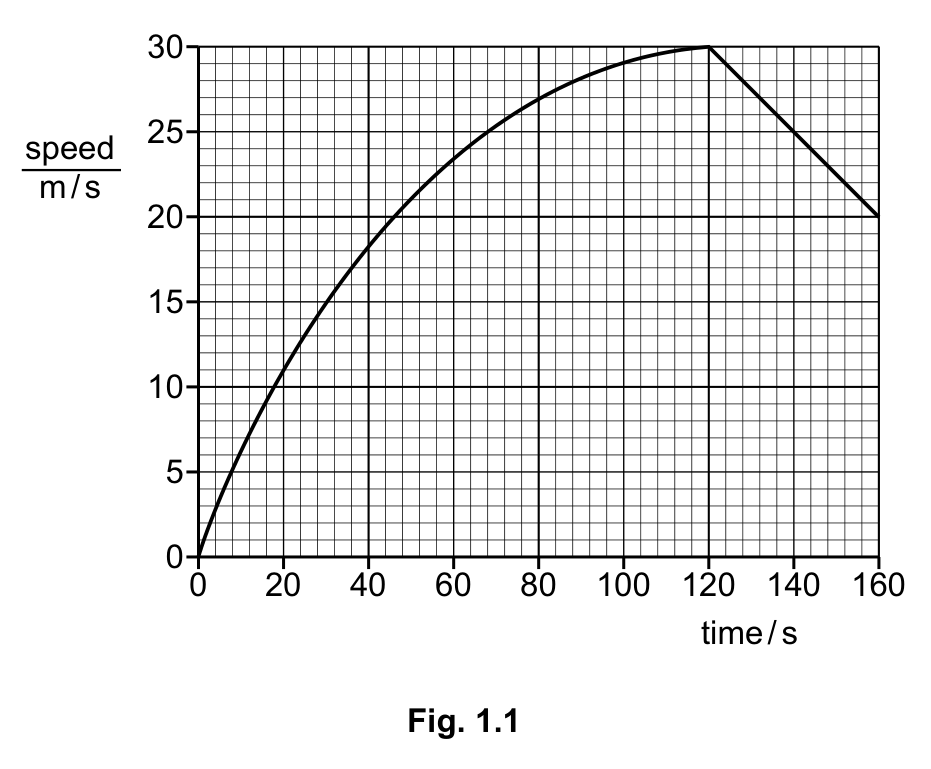
Fig. 1.1 — see the question text for what it shows

Calculate Show your working. The method can earn marks even when the final value is wrong, and a bare answer often cannot.

Your answer

Suggested time: 5 min

1(b)2 marks

Fig. 1.1 shows the speed-time graph for a vehicle accelerating from rest.

Without further calculation, state how the acceleration at time t = 100 s compares to the acceleration at time t = 10 s.

Using ideas about forces, explain why any change in the acceleration has occurred.

Fig. 1.1 — see the question text for what it shows

Using You must use the thing it names. An answer that reaches the right value another way may not score.

Your answer

Suggested time: 3 min

1(c)3 marks

Fig. 1.1 shows the speed-time graph for a vehicle accelerating from rest.

Determine the distance travelled by the vehicle between time t = 120 s and time t = 160 s.

Fig. 1.1 — see the question text for what it shows

Determine Work it out from what you are given or from the figure, and show how you got there.

Your answer

Suggested time: 5 min

0625/04/SP/23Cambridge IGCSE Physics 0625 · Specimen 2023 · Paper 4 · sit the whole paper